Webflow Input Enhancer
For the best experience, this project uses the Webflow Input Enhancer extension. We highly recommend installing it. Click here to download (use preview mode to access link)
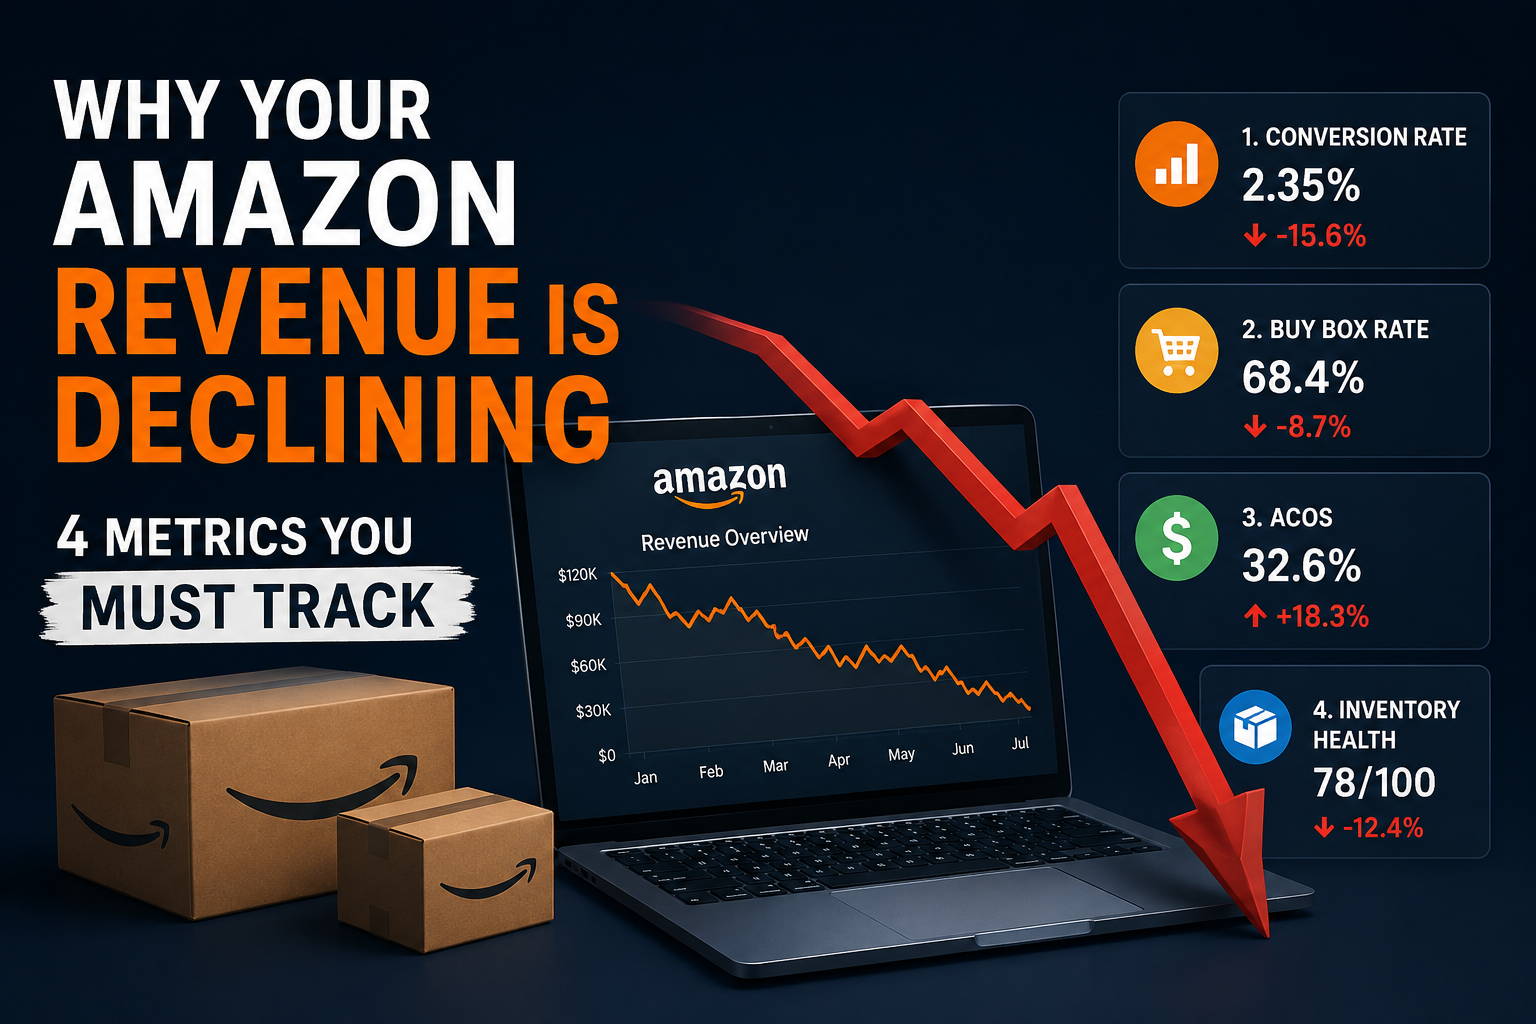
You wake up, check your Amazon dashboard, and notice revenue is down 15% from last month. Your first instinct? Check your ad spend, adjust bids, hope for the best.
Three months later, nothing's changed.
Here's what we've learned from auditing 60+ Amazon brands in revenue decline: the real answer almost never lives in the obvious places. It's buried deeper-in four metrics that most sellers never look at, let alone optimize.
The brands that figure this out stop hemorrhaging margin and start scaling again. The ones that don't keep burning cash on fixes that don't address the root problem.
This post walks you through the exact four metrics we use to diagnose revenue decline, and what each one actually reveals about your business.
When we start an audit, we don't look at channels. We look at the unit.
Specifically, we calculate margin per SKU after everything comes out: FBA fees, referral fees, returns, and storage. This is your real unit economics.
Most Amazon brands optimize at the channel level. They'll say: "Organic is good, PPC is fine, Sponsored Brands need work." But that's backward. The channel doesn't care about your product—your product cares about the channel.
Here's what we typically find:
Scenario 1: Your best-selling SKU is underwater. You're moving volume on a $45 product, but after all fees, you're left with $3 of margin. You spend $400/month advertising it thinking it's a winner. Meanwhile, another SKU selling half the volume has $22 per unit. The money you're pouring into promotion is actually making you more profitable in the short term and less so long-term, because you're training the algorithm to push an unprofitable product.
Scenario 2: Portfolio imbalance. You have one SKU carrying the entire margin load while others hemorrhage money. This creates fragility. When that one product hits a warehouse issue or gets review bombed, your entire business takes a hit.
How to fix it: Build a simple SKU P&L by calculating:
This single view answers the question "why is revenue down?" more often than anything else. Once you have it, you can make real decisions: unprofitable SKUs get cut or repriced, ad budgets move to true winners, and you stop throwing good money after bad.
If you sell a repeat-purchase product, you probably have a Subscribe & Save program. If you do, this metric matters more than you think.
Subscribe & Save subscribers are your business's foundation. They're the customers who come back without you having to bid on them again. They're predictable revenue. They're profit.
When they churn, your business takes a hit. But here's the trap: the churn doesn't always show up immediately on your dashboard.
A customer might cancel their subscription on day 28, but you won't see the revenue impact until day 35 or 40 when their next order doesn't go through. If you're only looking at daily or weekly reports, you might miss it entirely. Revenue looks flat one week and lower the next, and you're left asking: "What happened?"
What happened is churn.
How to fix it: Track subscription metrics separately from overall sales:
Churn of 5% per month sounds small. Over a year, it means you're replacing your entire subscriber base 1.8x just to stay flat. If you want to grow, you need new subs plus lower churn.
Compare your churn rate to competitors (if you can access it) and your own historical baseline. A 2-3% monthly churn is healthy. Above 5%? You have a problem that's costing you more than any ad optimization will fix.
Most Amazon sellers run ads. Most also have pockets of wasted spend they never see.
We run extensive ad audits on every client account, and almost all of them have the same issue: meaningful spend on campaigns that aren't converting, running at times when no one's buying, or promoting products that lose money with every sale.
Wasted spend by time of day: Your campaigns run 24/7. But your customers? They shop between 8 AM and 11 PM. You're burning money on 1 AM impressions, 4 AM clicks, and early morning bids that almost never convert. This is an easy win—use dayparting to shut campaigns down during low-conversion hours.
Wasted spend on low-converting products: You have a broad campaign running on your entire catalog. One SKU converts at 2%, another at 0.4%. You're spending equally on both. The low-converter is dragging your ACOS up. Either cut it from that campaign, exclude it, or reduce bid.
Wasted spend on wrong-fit campaigns: A campaign built to rank for "kitchen knives" is accidentally showing for "training knives" searches. CTR looks decent, but nobody's buying. The match type is too broad, or your negative keywords aren't tight enough.
How to fix it: Run a complete audit across all campaigns:
We typically find $5K-$20K in monthly wasted spend that can be reallocated to high-converting campaigns. That's real margin recovery, not optimization theater.
This is the metric that separates profitable Amazon brands from struggling ones.
Most sellers obsess over first-order economics. They calculate: "This $30 product costs me $8 in COGS and $12 in ads to acquire. That's only $10 profit per order. This product is failing."
So they kill it.
Then they wonder why revenue doesn't improve.
Here's what they missed: that $30 product might have a $400 lifetime value over two years because 40% of buyers reorder within 90 days, then again within 6 months, and again within a year. Your repeat rate is 3-4x, and you're not paying acquisition costs again on those orders.
When you only look at order one, you're blind to your best products.
For repeat-purchase products (vitamins, supplements, household essentials, pet supplies), customers acquired at a 2:1 LTV-to-CAC ratio on day one often look like 5:1 or 8:1 by month six.
How to calculate it:
If you're at 2:1 on day one but 6:1 by month six, that's a "low ACoS on the first order" problem, not a product problem.
Conversely, if your LTV-to-CAC stays flat at 2:1 even after six months, that's a retention problem. Your first order is fine, but repeat purchases aren't happening.
Revenue doesn't drop because of one thing. It drops because of a combination of unit economics problems you can't see if you're only looking at the surface.
Here's the diagnostic order we use:
Most Amazon sellers skip these steps. They tweak ad bids, hope something improves, and get frustrated when revenue stays flat.
The brands that recover do the work upfront. They face the metrics. They make hard decisions on unprofitable SKUs. They fix churn. They eliminate wasted spend. And suddenly, revenue doesn't feel mysterious anymore—it feels manageable.
If you're seeing revenue decline and don't know where to start, this is exactly what we do. A proper diagnostic audit takes 2-3 weeks, but it gives you the roadmap to recovery.
Schedule a free 30-minute diagnostic call with our team. We'll pull your numbers, walk through your SKU economics, check your churn, and show you exactly where the leak is.
No pitch. No upsell. Just honest analysis of where you're losing money, and what would actually fix it.
Q. Why is my Amazon revenue declining even when sales volume remains steady?
Ans. Revenue can decline despite stable sales volume due to shrinking profit margins, increasing FBA fees, higher return rates, rising advertising costs, or customer churn. Reviewing SKU-level profitability often reveals the real cause.
Q. How do I calculate profit per SKU on Amazon?
Ans. To calculate SKU profitability, subtract COGS, Amazon referral fees, FBA fulfillment fees, storage fees, returns, refunds, and advertising costs from total revenue generated by that SKU. This provides the true margin per unit.
Q. What is a good LTV-to-CAC ratio for Amazon sellers?
Ans. A healthy LTV-to-CAC ratio is typically 3:1 or higher. This means a customer generates at least three times more profit over their lifetime than the cost required to acquire them.
Q. How can I reduce wasted Amazon advertising spend?
Ans. You can reduce wasted ad spend by analyzing search term reports, adding negative keywords, pausing low-converting campaigns, implementing dayparting, and reallocating budget toward high-converting products and keywords.
Q. What is a healthy Subscribe & Save churn rate on Amazon?
Ans. Most successful Amazon brands aim for a monthly Subscribe & Save churn rate between 2% and 3%. A churn rate above 5% may indicate pricing, inventory, product quality, or customer experience issues.
Q. What metrics should Amazon sellers track to diagnose revenue decline?
Ans. When Amazon revenue starts declining, sellers should focus on four key metrics before making changes to advertising or pricing. First, analyze SKU-level profitability to identify products that are generating sales but losing money after fees and advertising costs. Second, monitor subscription churn if you use Subscribe & Save, as losing repeat customers can reduce predictable revenue. Third, review wasted ad spend by examining campaign performance, search terms, and conversion rates. Finally, calculate your LTV-to-CAC ratio to understand whether your customer acquisition efforts are generating long-term value. Together, these metrics provide a complete picture of what's causing revenue decline and where corrective action is needed.
Q. How does subscription churn impact Amazon business growth?
Ans. Subscription churn directly affects recurring revenue and customer lifetime value. When customers cancel their Subscribe & Save orders, brands lose future revenue without immediately noticing the impact. High churn rates force sellers to spend more on acquiring new customers just to maintain existing sales levels. Over time, this reduces profitability and slows business growth. Monitoring subscriber growth, churn rate, and reactivation rate helps Amazon sellers identify retention issues early and build a more predictable revenue stream.
Q. What causes Amazon profit margins to decrease?
Ans. Amazon profit margins can decline for several reasons, including rising FBA fees, increased advertising costs, higher return rates, storage fees, competitive pricing pressure, and inventory inefficiencies. Many sellers focus on sales growth while overlooking the impact of these expenses on profitability. Margin erosion often occurs gradually, making it difficult to detect without a detailed SKU-level profit and loss analysis. Regularly reviewing unit economics helps sellers identify cost increases and take corrective action before profitability is significantly affected.
Q. How often should Amazon sellers audit advertising performance?
Ans. Amazon advertising performance should be reviewed weekly, with a comprehensive audit conducted at least once per month. Weekly reviews help identify sudden changes in conversion rates, keyword performance, and campaign spending. Monthly audits provide a deeper analysis of search terms, wasted ad spend, dayparting opportunities, bid adjustments, and product-level profitability. Consistent audits help sellers eliminate inefficient spending and ensure advertising budgets are allocated to campaigns that generate profitable growth.
Q. What are the biggest revenue leaks in an Amazon FBA business?
Ans. The most common revenue leaks in an Amazon FBA business include unprofitable SKUs, excessive advertising spend, high subscription churn, rising fulfillment fees, poor inventory management, and low customer retention. Many sellers focus solely on increasing sales while ignoring these hidden issues that reduce profitability. Conducting regular audits of product margins, advertising efficiency, retention metrics, and operational costs can uncover significant revenue leaks and improve overall business performance.